
Getting started
Dashboard
The dashboard is the first thing you see when you sign in. It answers three questions without you clicking anything: what closed, what's still open, and who's carrying it.
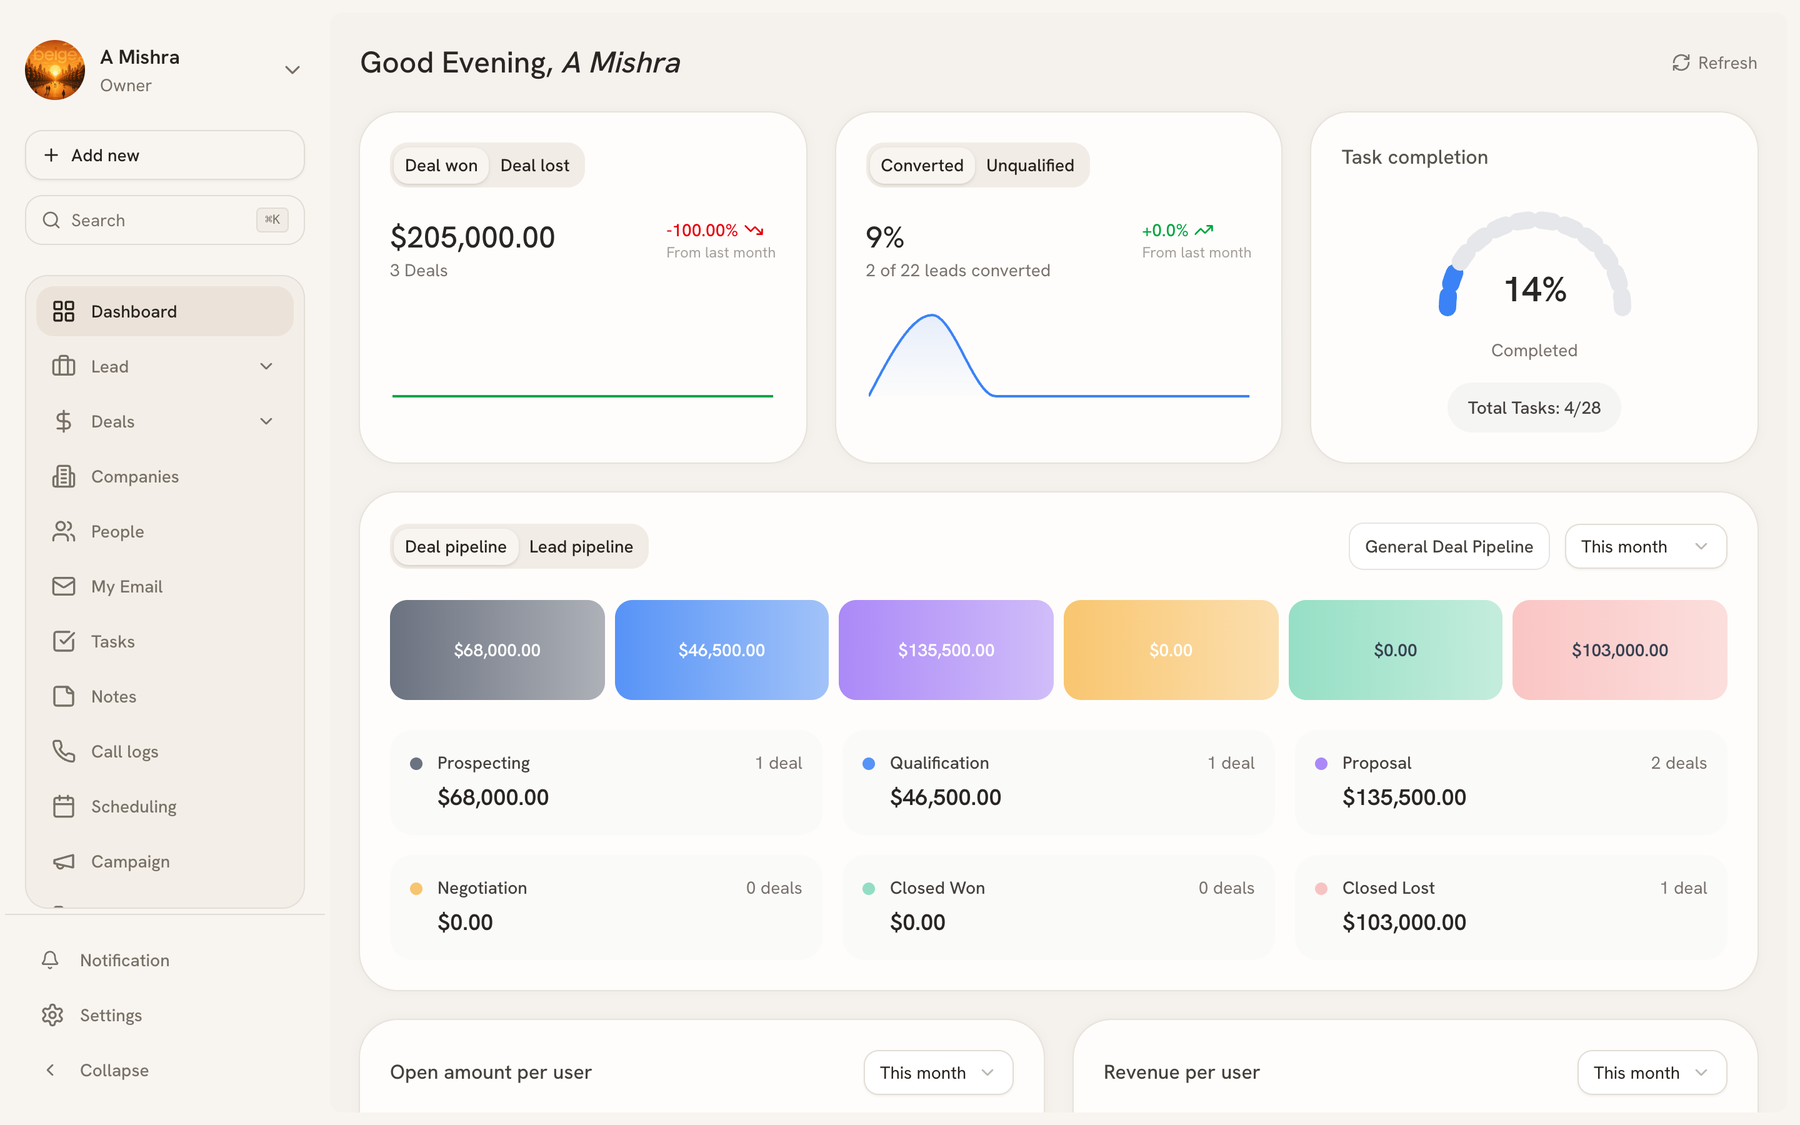
The top row#
Three tiles summarise the period you've selected:
| Tile | What it shows |
|---|---|
| Deal won / Deal lost | Revenue closed in the period, the deal count, and the change from last month. Toggle between won and lost. |
| Lead won / Lead lost | The same, for leads. |
| Task completion | Percentage of your tasks completed, with the raw count underneath. |
Each tile carries a sparkline so you can see the shape of the period, not just the total.
Pipeline breakdown#
Below the tiles, the pipeline panel shows every stage with its total value and deal count — the coloured bars across the top are the same figures at a glance.
Three controls change what you're looking at:
- Deal pipeline / Lead pipeline — switch between the two pipeline types
- Pipeline selector — if your team runs more than one, pick which
- Period — the date range everything on the panel respects
Per-user panels#
Open amount per user and Revenue per user break the same numbers down by owner, which is the fastest way to see how work is distributed across the team. Both carry their own period selector, so you can compare a rep's month against the team's quarter.
Last updated 2026-08-14