
Insights
Reports
The Dashboard answers "how are we doing right now". Reports answers the slower questions: where deals stall, which sources actually convert, how this quarter compares to last.
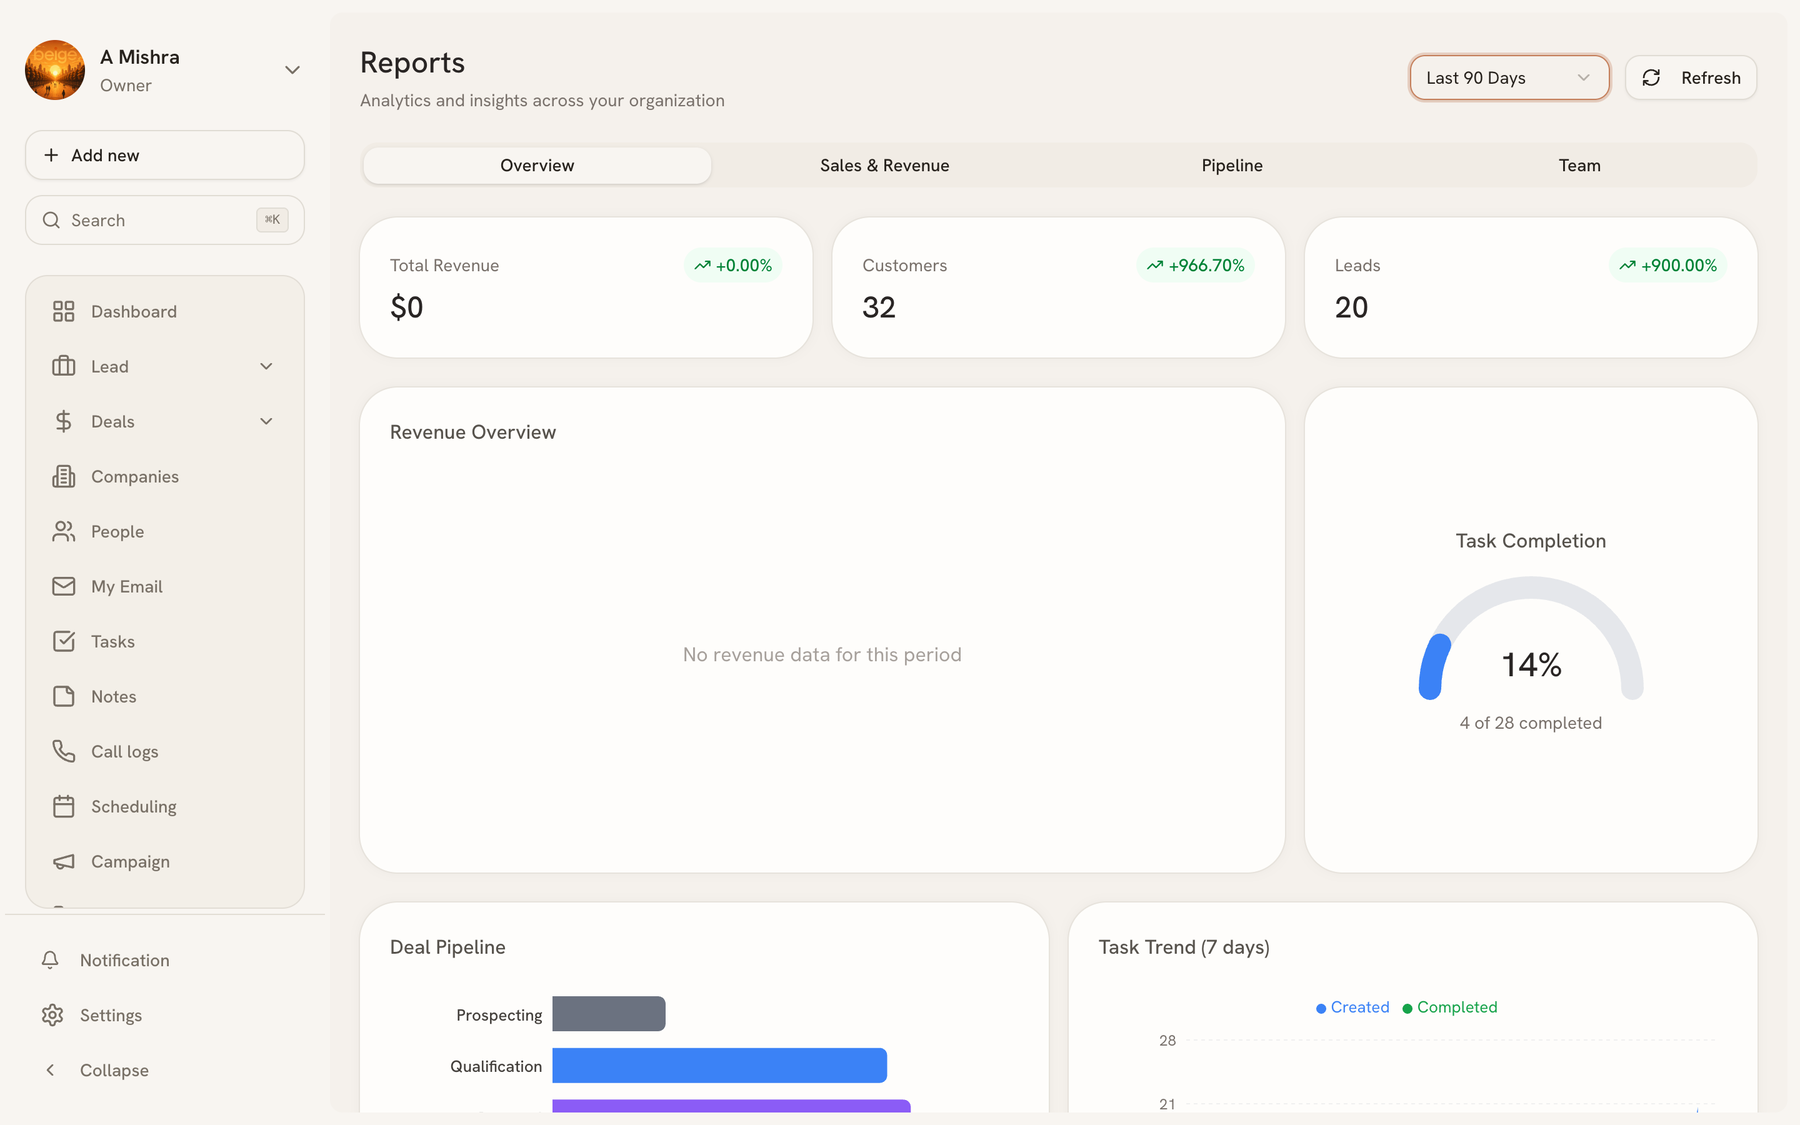
The four tabs#
| Tab | Answers |
|---|---|
| Overview | Total revenue, customers, leads, revenue over time, task completion, pipeline shape. |
| Sales & Revenue | What closed, and how that compares to the previous period. |
| Pipeline | Value and count by stage — where work is accumulating. |
| Team | The same figures split by owner. |
A period selector at the top right (default Last 30 Days) applies to everything on the page, and Refresh re-runs the queries without a reload.
Reading a funnel#
The useful number in a pipeline report is rarely the total — it's the drop between two stages. A pipeline that loses most of its value between Proposal and Negotiation is telling you something specific about pricing or authority, and it's invisible in a headline revenue figure.
Compare like periods. A month-over-month view of a business with a 60-day sales cycle mostly measures noise.
Reports and plans#
Advanced reporting is a plan entitlement. On a plan without it, the Reports item does not appear in the sidebar at all — so if a colleague can't find this page, check the organization's plan before anything else. See Team and settings.
Last updated 2026-08-14